Cassini MIMI |
IntroductionNASA's Cassini mission to Saturn has provided a unique opportunity for the Magnetospheric IMaging Instruments (MIMI) to study the energetic charged particle environment, and obtain images of Saturn using Energetic Neutral Atom (ENA) imaging. There is a rich dataset of spectrograms, plots, movies, and images that are now accessible via a dedicated app, which brings the browsing capabilities of the MIMI database to the touchscreen technologies that exist on mobile devices such as smartphones and tablets. Currently, the CassiniMIMI app is only operational on iPhones and iPads, and the app is available for free from Apple's iTunes App Store.Among the data products within the MIMI suite that are viewable through the app, include the ENA images of Saturn taken with the Ion and Neutral CAmera (INCA), and spectrograms and line plots from the Low Energy Magnetospheric Measurement System (LEMMS) and CHarge Energy Mass Spectrometer (CHEMS) particle detectors. The instrument health and safety data are restricted to Cassini team members, while the calibrated science data are available to all. The CassiniMIMI app provides easy access to some of Cassini browse products that are in NASA's publically accessible Planetary Data System (PDS). For some products, the public is now able to see the most up-to-date plots produced on a daily basis. Also, the public now has access to new MIMI data products that are only in the process of being released to Planetary Data System (PDS) Planetary Plasma Interactions Node.. Checkout the public menu selections, highlights of the display, samples of public plots and movies, and links to supporting sites. |
||
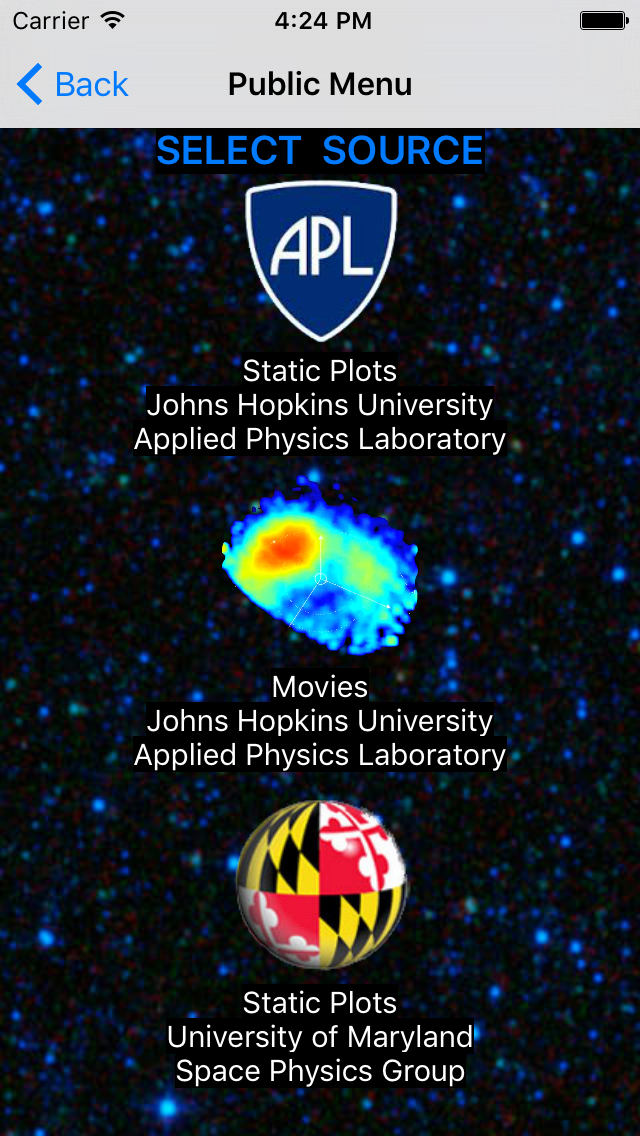
Public MenuThe publically available browse products are selectable by source, type, date, style, plots, and movies (Figures 1-5).Two institutions source the products: Johns Hopkins University Applied Physics Laboratory (APL) and University of Maryland (UMD) Space Physics Group. APL produces two types of products: ENA movies, as well as static plots, while UMD produces only static plots (Figure 1). |
 |
|
|
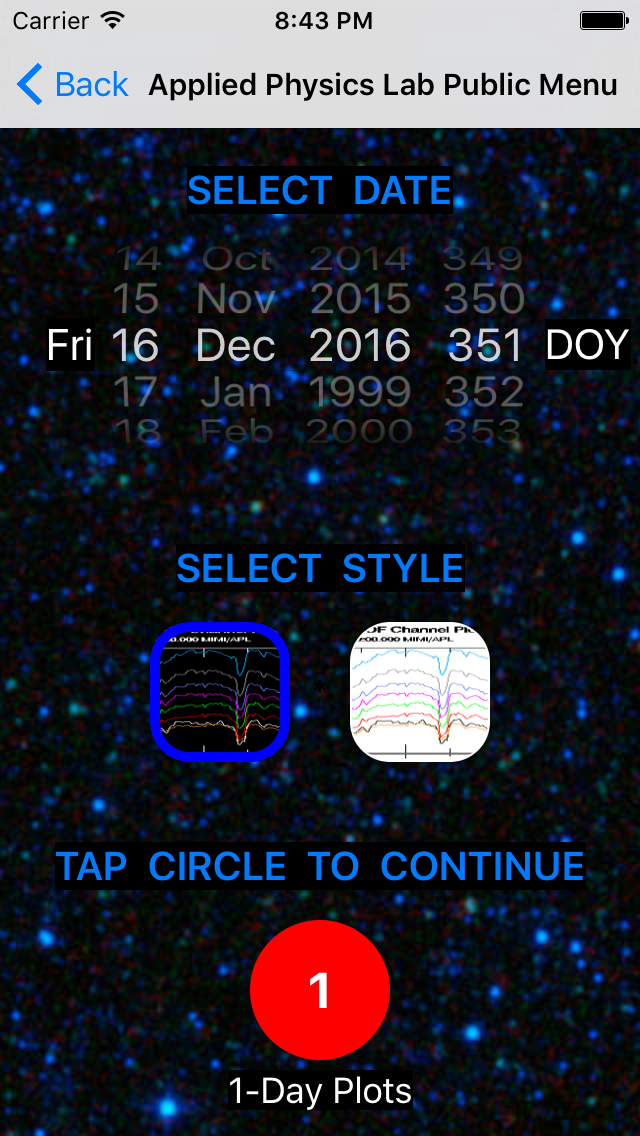
Date is selected on a spinning wheel (Figure 2), specified either by (day, month, year) or
(day-of-year, year). A handy feature is that (day-of-week, day, month, day-of-year) are always consistent.
1999 is the first year that there are any data available, and useful data were not abundant until Cassini
began its Saturn orbital tour on July 1, 2004. While most data types are available throughout the mission,
there are gaps associated with operations, as well as unplanned gaps, as a consequence of rare downlink
telemetry outages, and even rarer spacecraft or instrument anomalies. When specifying a date for a
multi-day plot, the date just needs to be within the time interval. |
||
| Two styles of background can be chosen for APL plots (Figure 2). Some plots are displayed both on a black background, as well as on a white background. If a black background is selected, but a plot with white background is displayed, or vice versa, it means that this particular plot is only available with one background color. |
 |
|
|
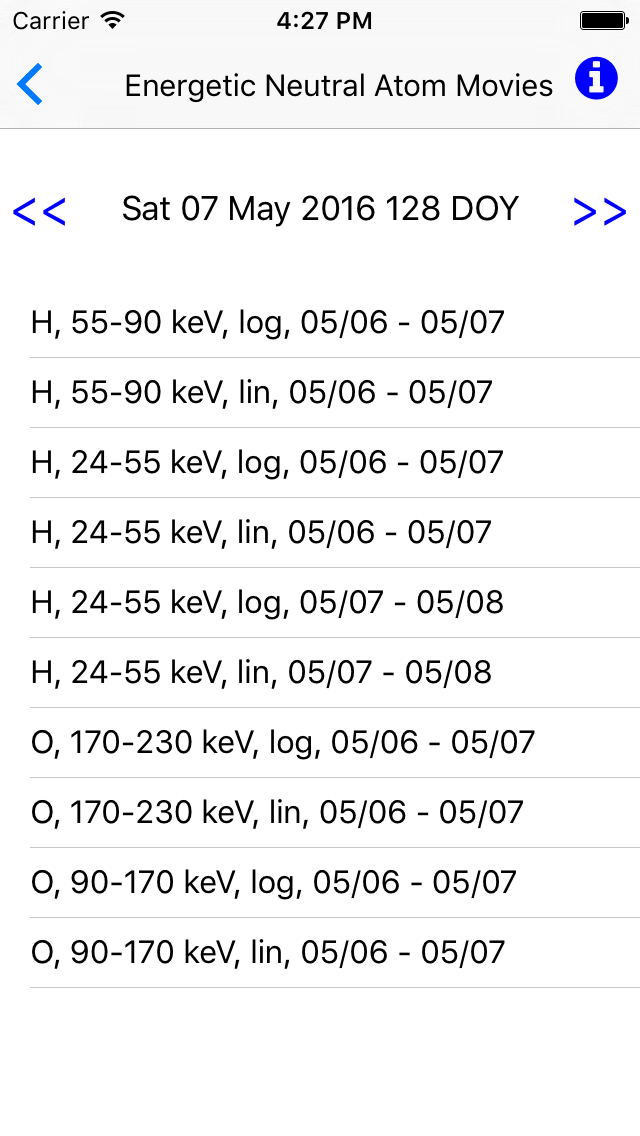
Eight different types of plots, and movies with various attributes, can be selected. All are either regularly
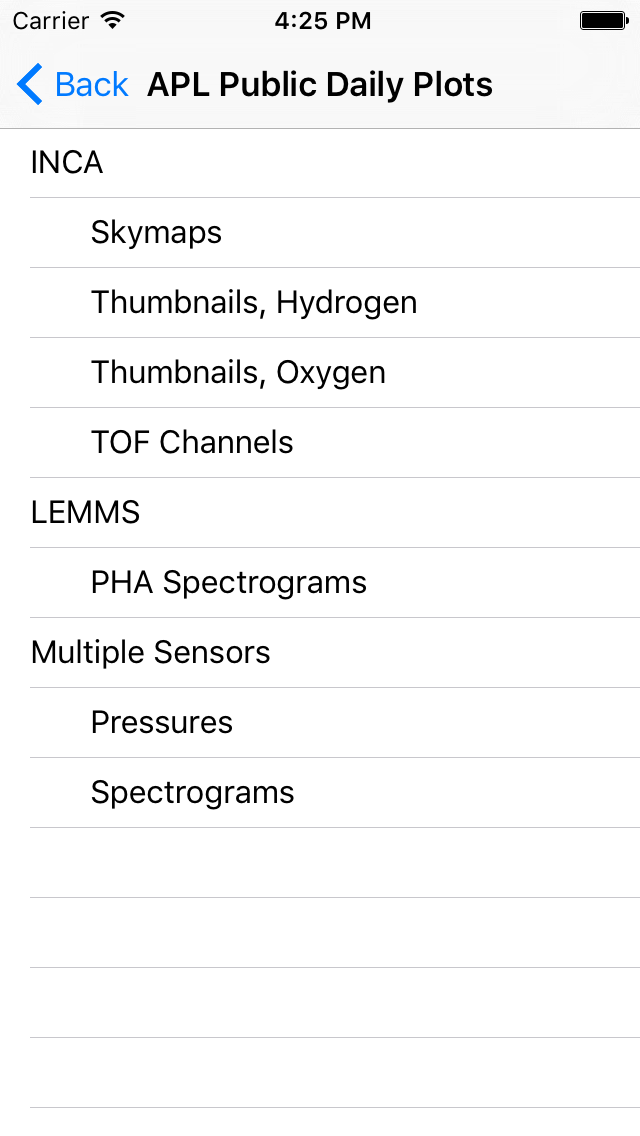
archived, or in the process of being archived (Figures 6, 9), at NASA's PDS. APL offers daily static plots
(Figure 3) and multi-day movies (Figure 4). Some plots use data from one sensor, and others use data from a combination of CHEMS, INCA, or LEMMS sensors. The number of movies offered varies by the day. Each is a high spatial resolution hydrogen or oxygen image, with an energy range corresponding to high or low time-of-flight (TOF), using log or linear value of the image intensity, over a range of days. |
  |
|
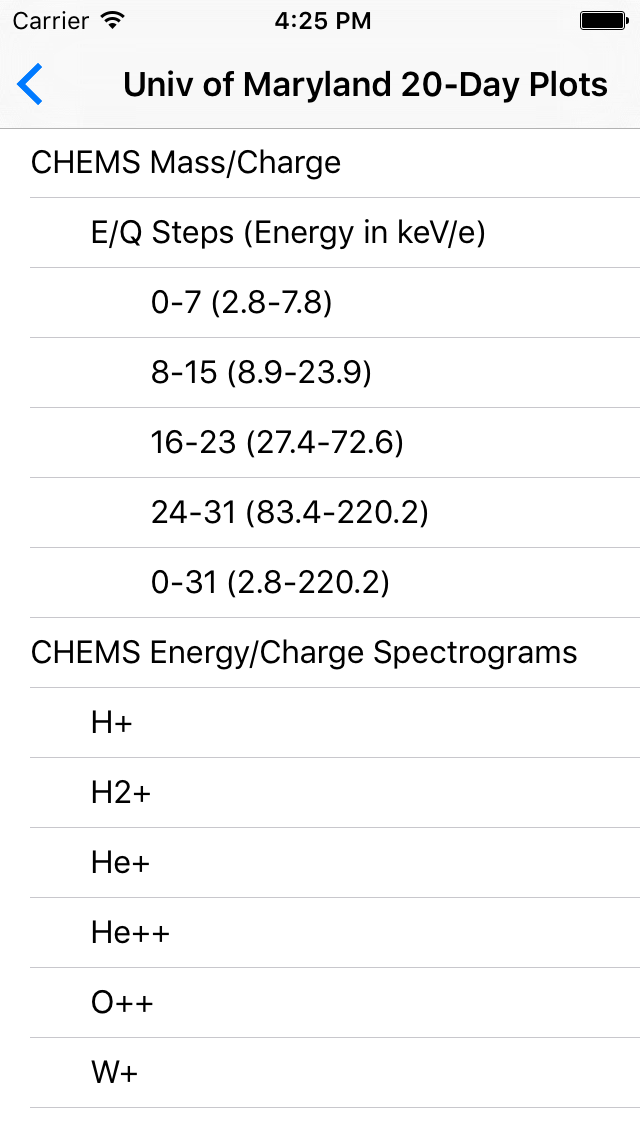
| UMD offers 20-day static plots (Figure 5) that use either the CHEMS mass/charge data or the CHEMS energy/charge data. The mass/charge data can be viewed by each individual energy step, or as a summary of all four energy steps. The energy/charge data is available for six ion species: H+, He+, H2+, He++, O++, and W+. |
 |
|
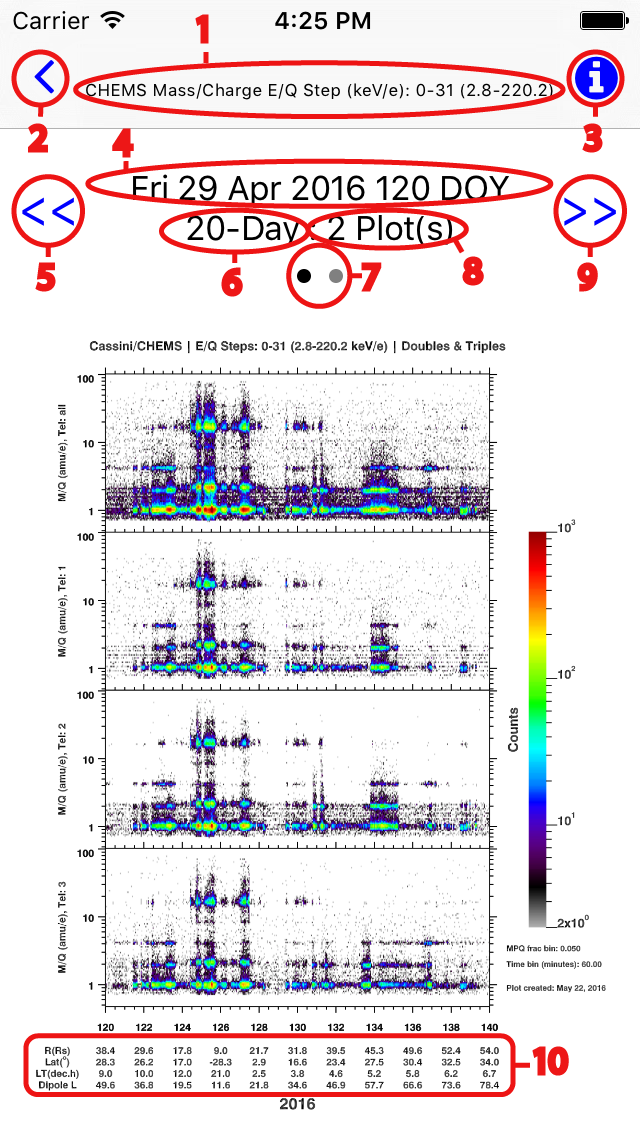
Display HighlightsThe image of every static plot can be manipulated by fingers, enlarge, reduce, and move around. A double tap brings the image back to its original size. As for the movies, a double tap toggles between an enlarged and a normal sized image, and a single tap brings the progress bar in and out of view. The movie legend is best viewed in iPhone's landscape orientation, enlarged and without the progress bar.Three lines of information are displayed at the top of every plot (Figure 6). The first line is the title (1). The second line is the date (4), which is the beginning of the time interval. The left side of the third line is the time interval (6), and the right side is the number of plots (8) retrieved. If there is more than one plot, a set of dots (7) appears, where each dot represents a plot. The plot in the series that is currently displayed is darker than the rest. |
 |
|
| A swipe from right to left brings up the next plot for the selected date, while a swipe from left to right brings back the previous plot. The x-axis not only shows time, but also the position of the Cassini spacecraft (10) in Saturn's equatorial coordinates. When the information icon (3) is tapped, a scrollable information page is brought into view, where the print size can be adjusted with fingers. A tap on the page brings back the plot. When the single left arrow (2) is tapped, the previous menu screen appears. When the double left arrows (5) are tapped, the display changes to the previous plot, skipping over any day with no plot. Likewise, when the double right arrows (9) are tapped, the display changes to the next plot. When the iPhone is in the landscape orientation, the header information (4-9) is hidden so that the plot fills the entire screen. A tap brings the header in and out of view. | ||
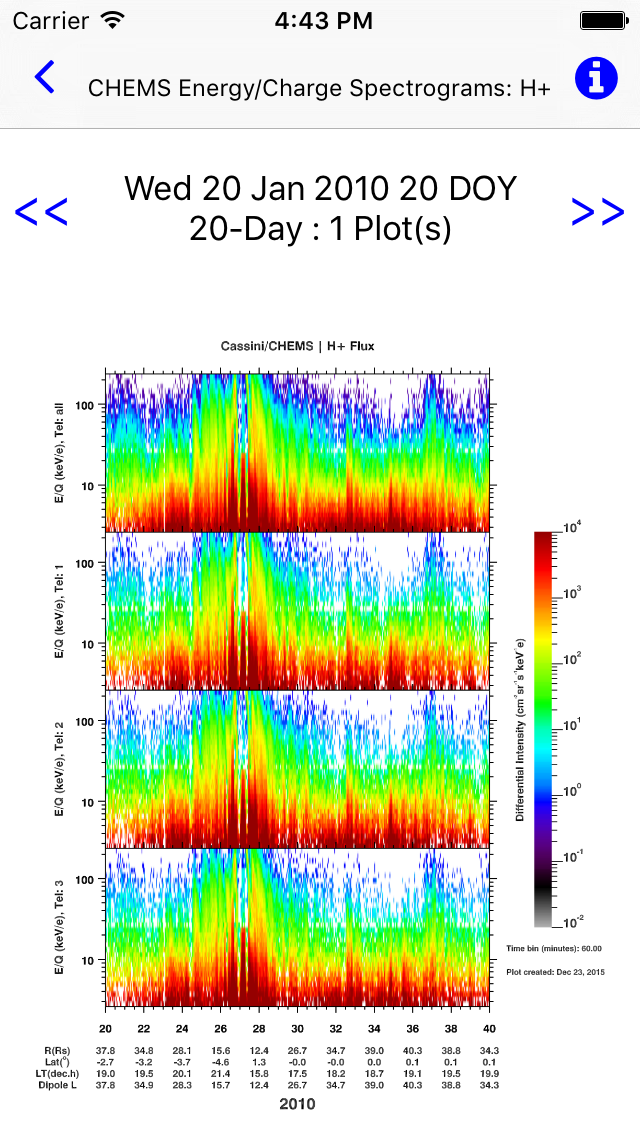
Public Plots and MoviesFigure 6 shows a plot of the CHEMS mass/charge data with E/Q step of 0-31 with energy in the 2.8 to 220.2 keV/e range, and Figure 7 shows a plot of the CHEMS energy/charge spectrogram for H+ flux. For both figures, there are four graphs stacked one on top of the other. The top graph shows data from all three telescopes combined, while the lower three graphs show data for each of the telescopes. The y-axis shows the PHA data on a log scale, while the x-axis is in time and spacecraft positions. |
 |
|
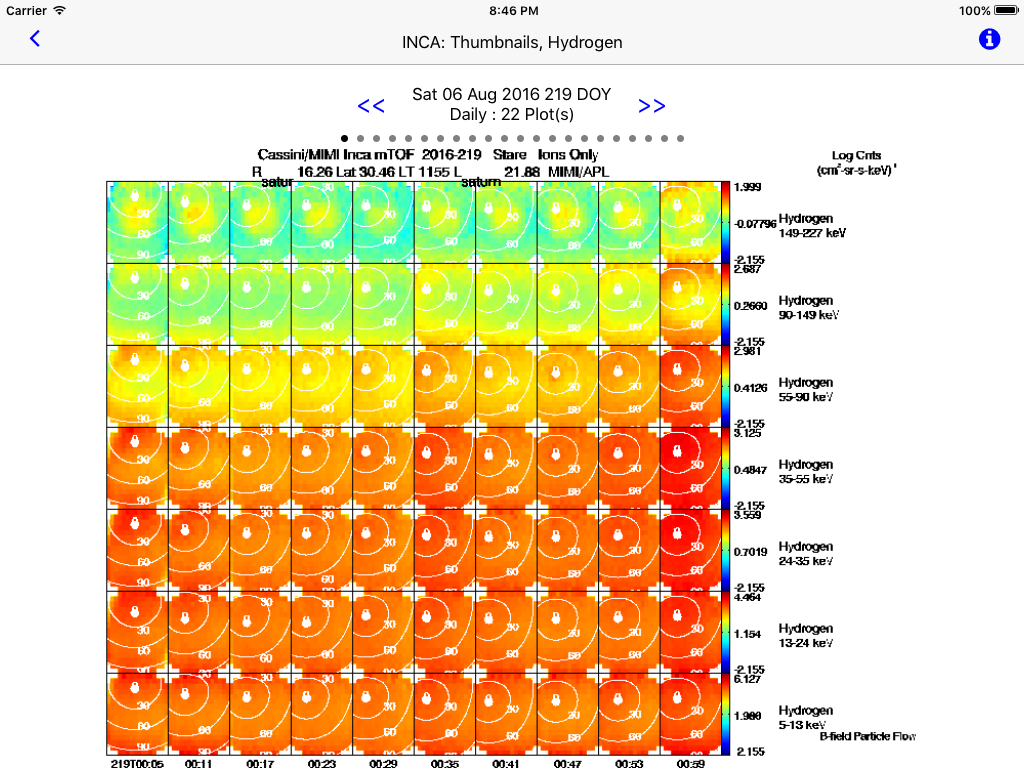
| Thumbnails are provided for both the hydrogen and the oxygen ions. Each thumbnail shows a long duration field-aligned ion beam. Figure 8 shows the thumbnail images for hydrogen. The y-axis is in Time-Of-Flight (TOF) ranges. The x-axis is in time, and each subsequent 22 plots extends the timeline. | ||
 |
||
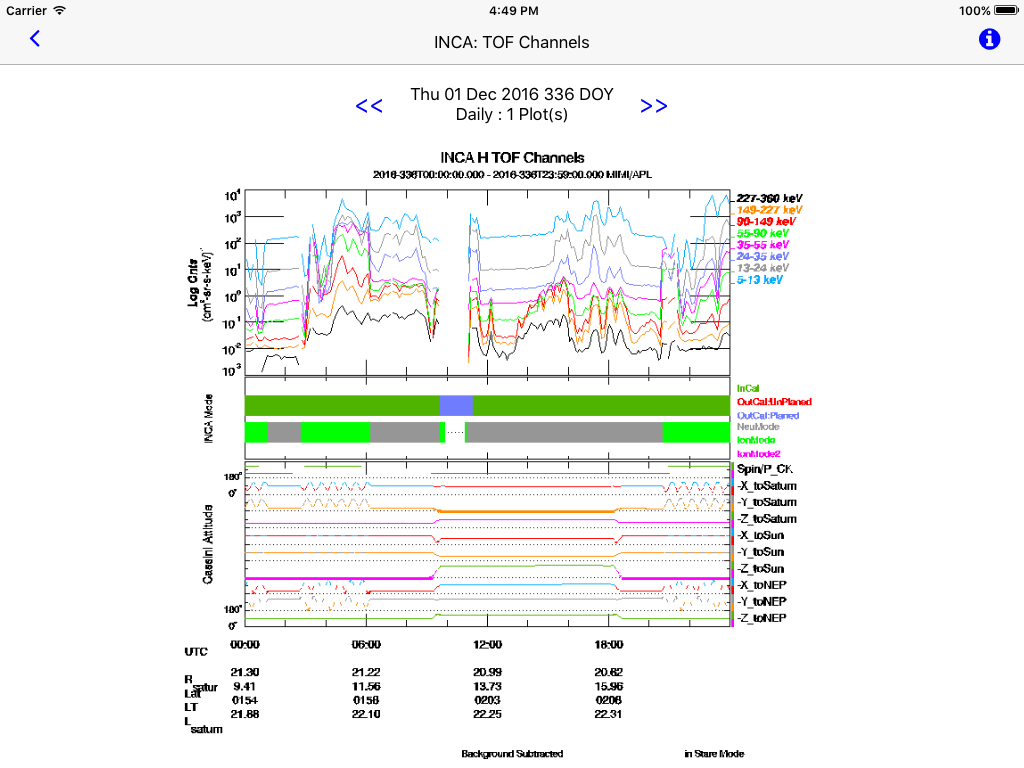
| Figure 9 shows an INCA high TOF channel plot. There are three graphs stacked one on top of the other. The top graph shows image intensity plotted on a log scale. The value is calculated by collapsing the images in angle to form an image-integrated intensity, and each color represents a different energy range. The top bar of the middle graph shows the calibration state for the INCA sensor, while the bottom bar indicates the neutral or ion mode. The bottom graph is the spacecraft attitude in degrees to Saturn, the Sun, and Neptune, while the top line is green when the Cassini spacecraft is in the z-axis spin. The x-axis is in time and spacecraft positions. | ||
 |
||
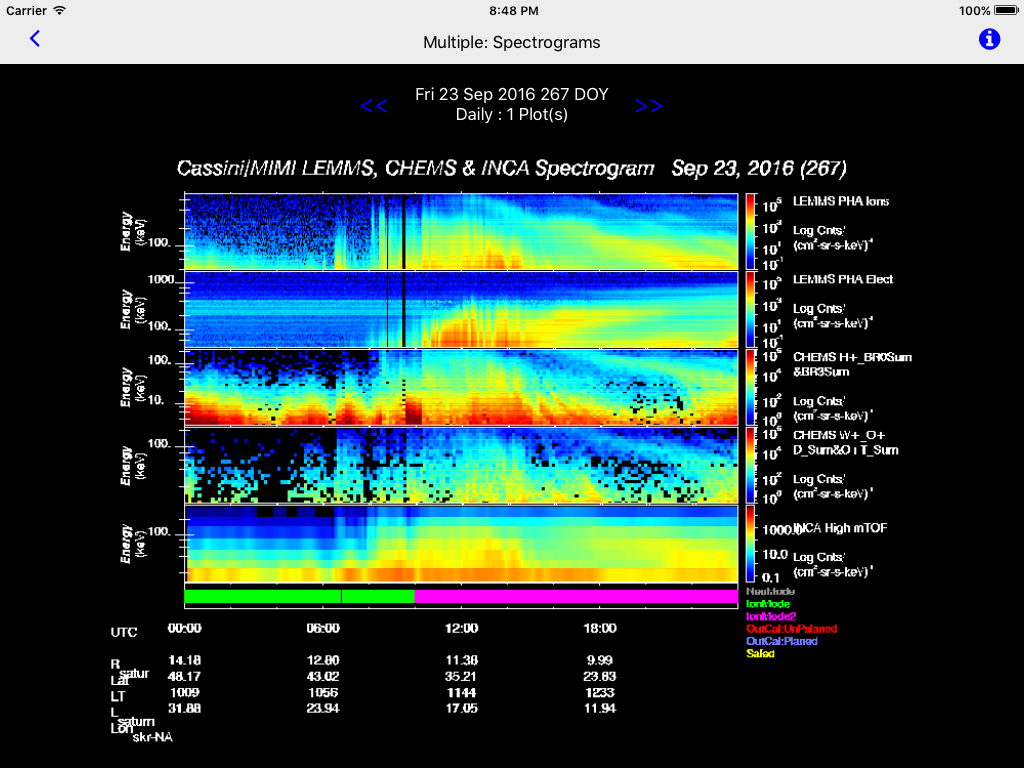
| Figure 10 shows LEMMS, CHEMS, and INCA spectrograms. There are six graphs stacked one on top of the other. The first two graphs show energy-time spectrograms for the LEMMS PHA ion data and LEMMS PHA electron data. The third and fourth graphs show the CHEMS proton data and the water ion data, respectively. The fifth graph shows INCA images, which are 2-D angular distributions in ion modes, collapsed to form an image-integrated intensity. The sixth graph is a bar plot of the calibration state of the INCA sensor. The y-axis is energy on a log scale, while the x-axis is in time and spacecraft positions. | ||
 |
||
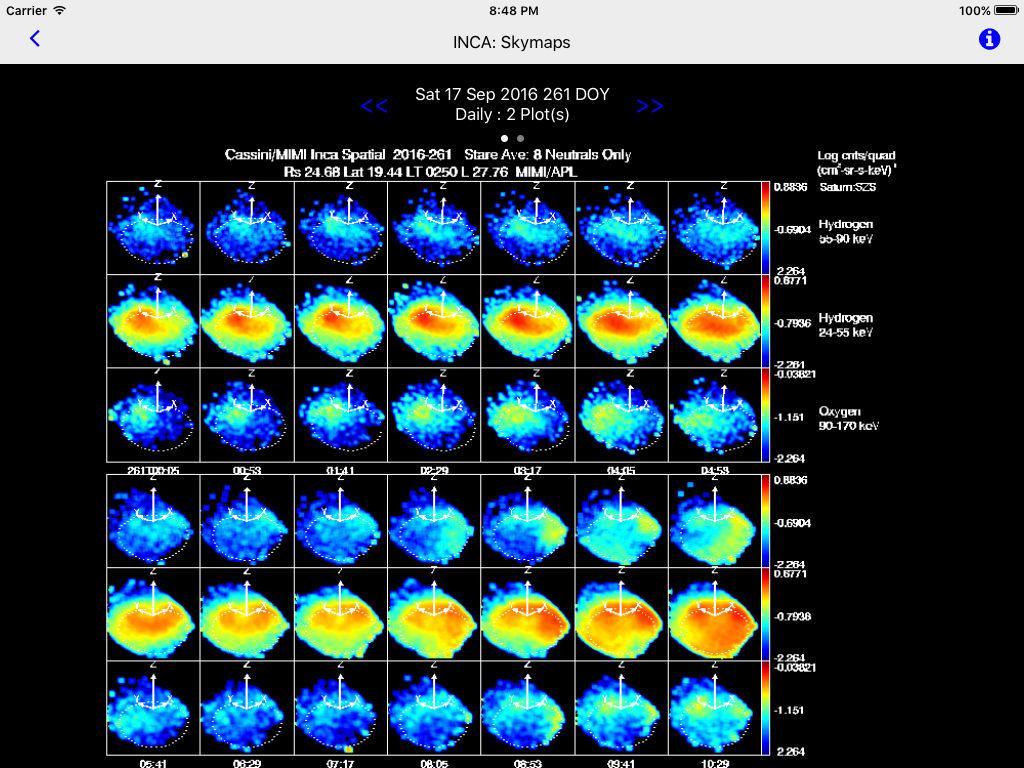
| ENA skymaps are collected when the voltage on the INCA collimator is high, typically >1.8 kV. Figure 11 shows high spatial resolution ENA skymaps for high TOF for hydrogen, low TOF for hydrogen, and high TOF for oxygen. Each is separately plotted in a row. There are two sets of triple rows, stacked one on top of the other. The x-axis is in time. The bottom set of triple rows is a continuation in time of the first set, and each subsequent plot extends the timeline. | ||
 |
||
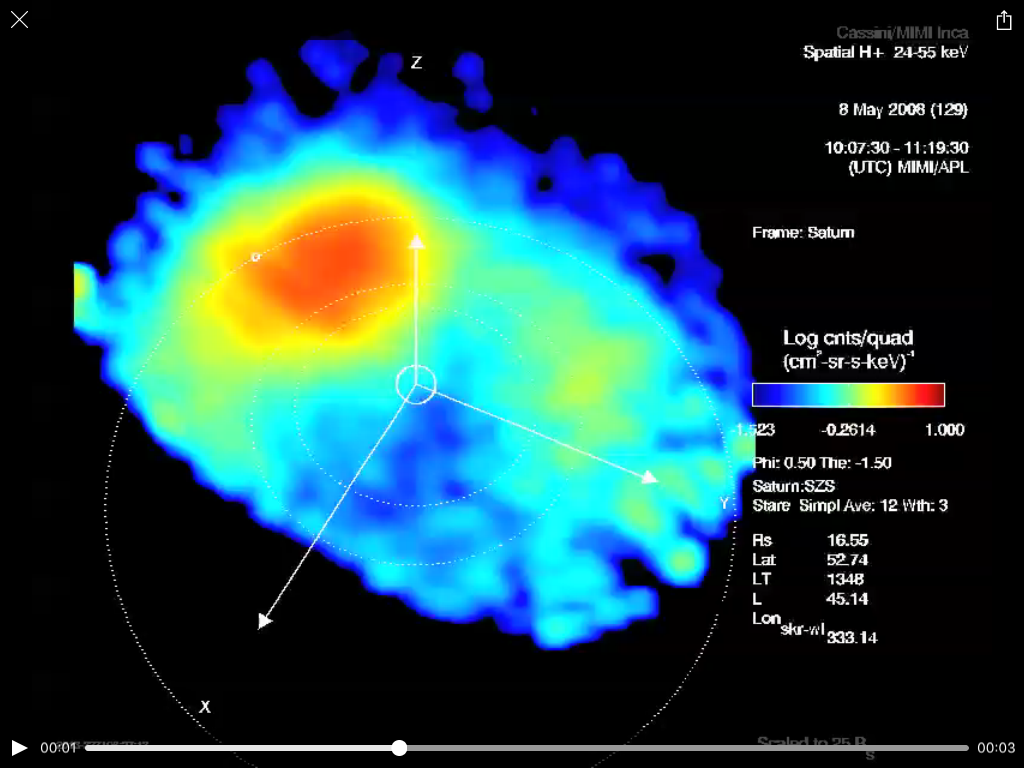
| When the Cassini latitude is either < 20 or > 30 degrees, and the solar elongation angle is > 50 degrees, the skymaps are made into movies. The movies are mostly Saturn focused, but sometimes they are Titan focused. Figure 12 shows a Saturn focused movie frame of the average ENA image skymaps for low TOF hydrogen. The value displayed is the log of the image intensity. Each of the original pixels is transformed into the Saturn frame, where the primary x-axis is the Cassini spacecraft-to-Saturn vector, the secondary z-axis is the Saturn spin axis, and the y-axis completes the right-handed system. | ||
 |
||
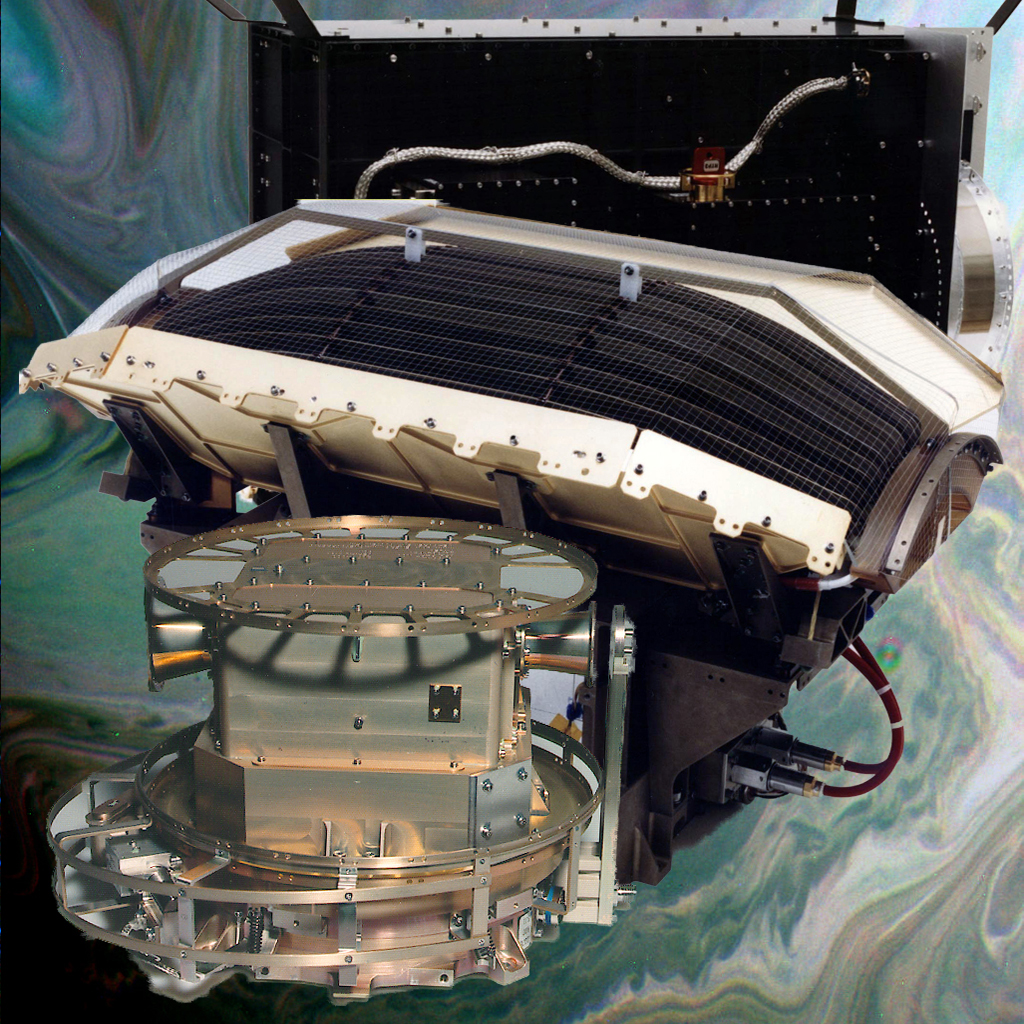
CassiniMIMI IconThe CassiniMIMI app icon, is a photo of all three MIMI sensors, placed one in front of the other, in the order of LEMMS, INCA, and CHEMS. The sensors are displayed against the backdrop of an infrared Saturn clouds image, filmed by Cassini on July 20, 2016, produced by Kevin M. Gill of NASA Jet Propulsion Laboratory. |
|
|
LinksJust below the title, there are handy links to the following:
|
||
Acronyms
| ||
| Note: This is a slightly modified version of "iPhone App for Cassini's Magnetospheric Imaging Instrument (MIMI) Browse Products" by Helene Y. Myers, Martha B. Kusterer, Donald G. Mitchell, Robert J. Steele, and Jon D. Vandegriff, all of Johns Hopkins University Applied Physics Laboratory (APL), Laurel, MD, presented at the American Geophysical Union (AGU) Fall Meeting, San Francisco, CA, December 12-16, 2016. | ||
 Need More Information?
If you need assistance with this software, please see the software support page. |
||